Posted by Chris Russell on June 12th, 2020
There I was…looking at the reflection of a body I no longer recognized. I was an athlete and although I’d gone through the ups and downs of body weight, never like this. A gentle poke of the tummy produced a visible jiggle that lasted more seconds than I’m comfortable sharing. I knew in that instant that I had become infected with what one can only deem as COVID gut.
COVID gut is similar to the freshmen 15lbs or the first-year teacher 40lbs, but with one key difference- the existential dread that accompanies the feeling that life has fundamentally changed for the foreseeable future. I decided that it’s time for me to fight this COVID gut beast, and my weapon of choice, data science.
Welcome to part 1 of my COVID gut journey that hopes to help teach folks some data science skills through a very personal use case.
Objective – Chris will be able to decrease body weight from 222lbs to 190lbs or below
Hypothesis – If Chris follows an intermittent fasting schedule 16:8 (8:00 AM – 4:00 PM).and reduces calories to <=1500 a day, then he will decrease his body weight and destroy COVID gut.
Variables:
- total_calories – Calories must be 1500 or less a day and is measured by the calorie tracker
- weight_am – Weigh-in occurs every morning at 8:00 AM EST, measured in lbs
- weight_pm – Weigh-in occurs every evening at 8:00 PM EST, measured in lbs
- exercise_cal – Measured by apple watch of total calories burned throughout day
- exercise_min – Measured by apple watch of total dedicated exercise minutes
- sleep (hh:mm) – Measured by smart sleep device
- energy_level – 6-point Likert scale ranging from 1 (not at all) to 6 (completely so) to the question,”Feel energetic to do everything”
- time – Each day all food consumption will take place between the hours 8:00 – 4:00 PM
Setting up the data collection instrument – For the purposes of this journey, I felt setting up a google sheet would be easiest to use for data intake, particularly for counting calories.
![]()
Let’s look at a few features of sheets I incorporated into this calorie counter:
Freeze Rows
Freezing the top row allows me to input data and easily see the column variable. Since I do alot of input on my phone, this is super helpful!
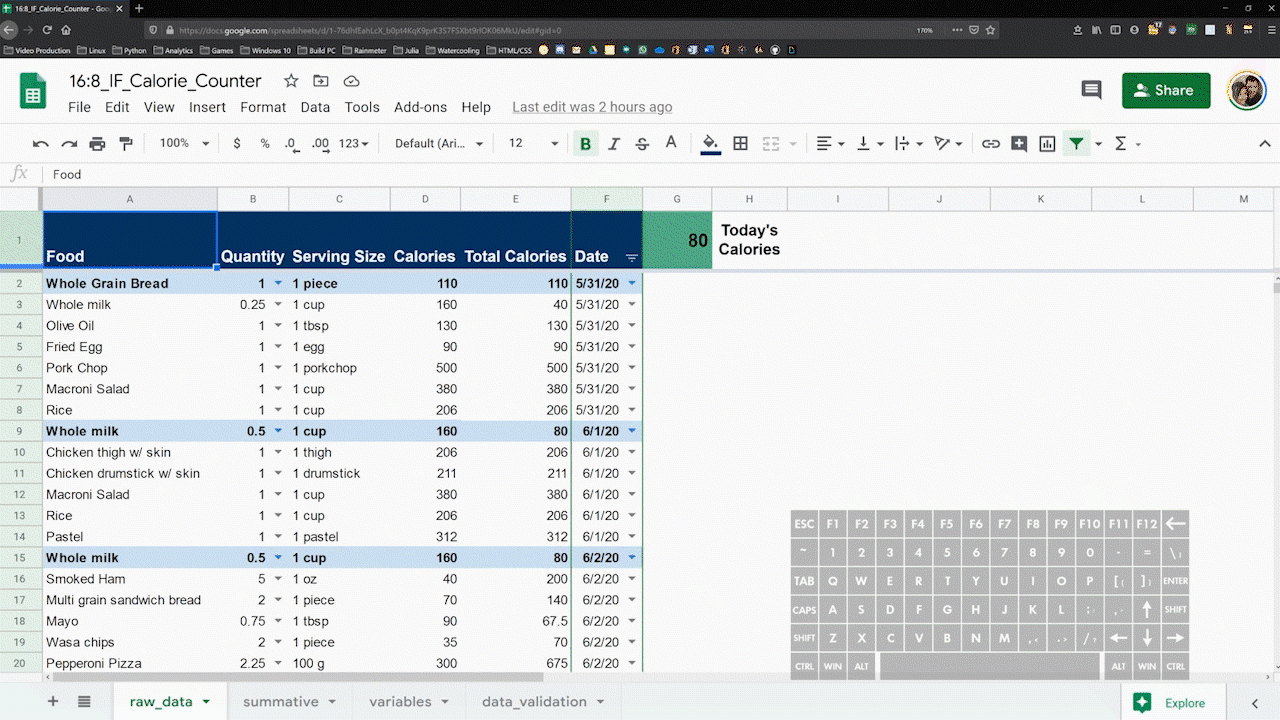
Conditional Formatting
I used conditional formatting to auto update the first row that represents the present date. This makes it easier to see where a new day begins!
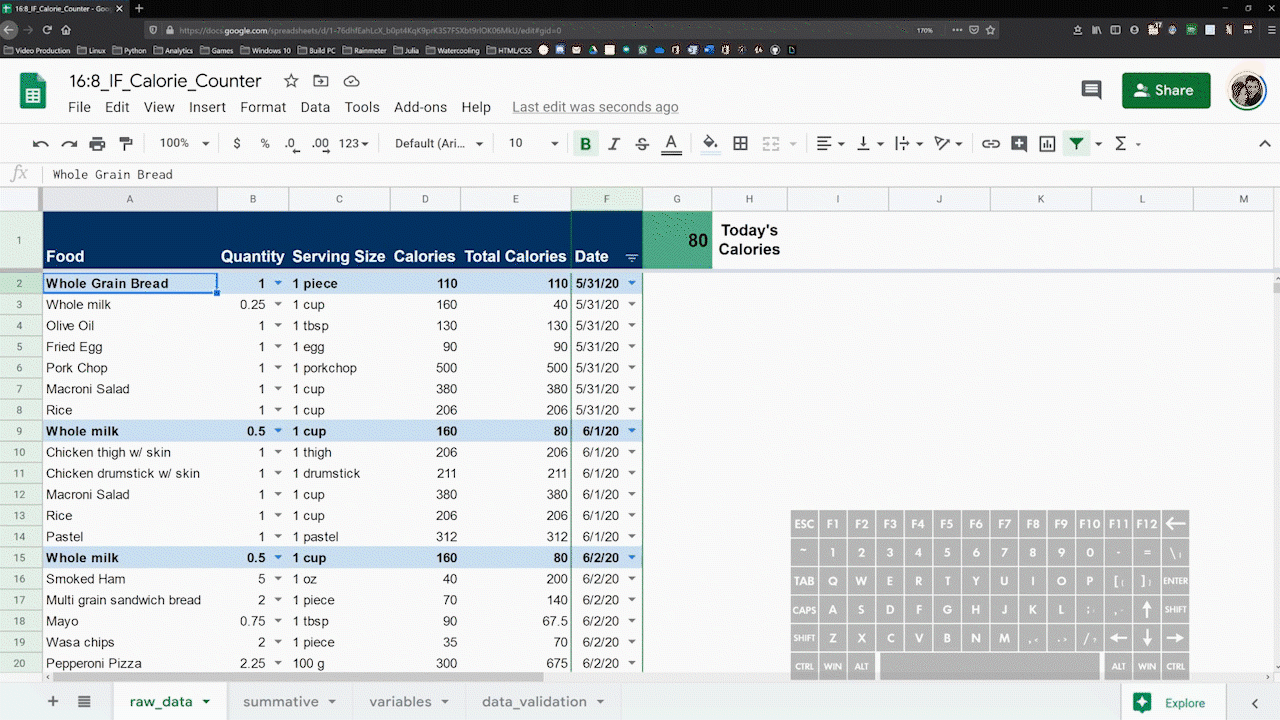
Sumif() & today()
I combined the sumif() formula with the today() functionality to calculate my daily calories. This is helpful when I need to know how close I am to hitting my 1500 calorie cap.

Data Validation
I have a tendency to fat thumb inputs on my phone, so I added data validation where appropriate for dropdown functionality.

This wraps up part 1 of this journey- I’m hoping to cover more concepts in both google and python as I continue this journey! See a sneak peek of an interactive python graph below displaying progress so far!
-Chris Russell